The Eco-Programmer's Guide
The Problem
Emissions from CPUs a big a problem. Due to the nature of software scaling, small performance increases lead to massive differences in power consumption and global CO2 emissions. The question is: how many emissions? For how many users? How much of an impact could our software optimization make?
In response to my last article "The Eco-Programmer's Dilemma" many readers argued that HTML5 (electron and other such technologies) make no noticable impact on the environment, and that they are not worth eschewing in favor of more eco-friendly technologies. Let's do a brief analysis of how CO2 emissions scale for HTML5 apps.
QT vs HTML5
If we look at the whitepaper titled: "QT or HTML5" published by QT, we can see alarming statistics. The RAM requirements of a comparable QT application are 4-8X less than that of a similar HTML5 application. Furthermore, the CPU delta is comparable to using a single-core last-gen processor instead of requiring a four-core current-gen processor for a similar embedded application experience.
What does this mean? It means NOT ONLY are the CPUs that run HTML5 apps putting out more pollution into the atmosphere, they are also generating more e-waste by requiring consumers to more frequently upgrade their machines to keep up with the bloat. If we accept this, it leads to the question: how much environmental damage is Slack almost directly responsible for? How many people have upgraded their laptops just to run Atom and Slack?
Power Consumption Comparison
How is the increased power consumption of these HTML5 apps directly generating more CO2? If we look at the variability of power consumption of a machine we can see that performance is related to amount of watts dissipated.
PassMark has a X-Y scatterplot that shows how as CPU performance scales, so does TDP (waste heat).
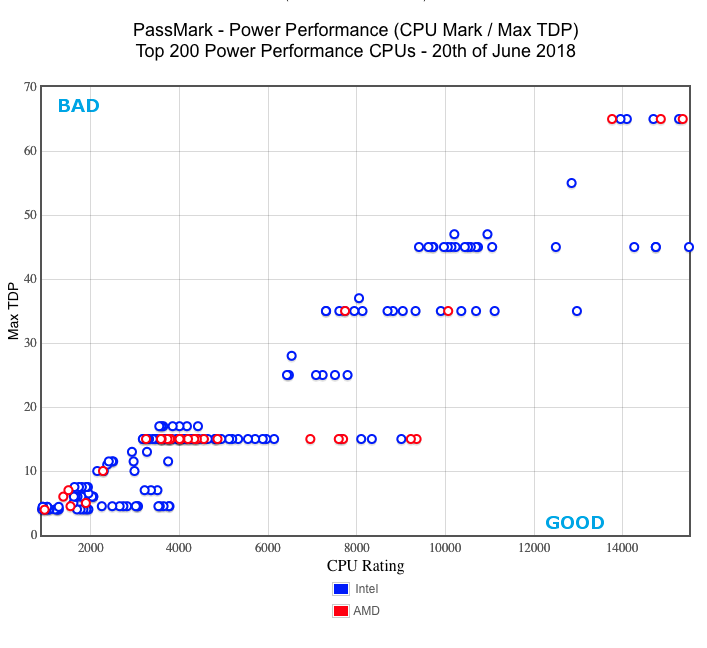 https://www.cpubenchmark.net/power_performance.html#id4
Note: The above chart ONLY considers the TDP (total dissipation)
required for a specific CPU under maximum load.
https://www.cpubenchmark.net/power_performance.html#id4
Note: The above chart ONLY considers the TDP (total dissipation)
required for a specific CPU under maximum load.
Continuing on this train of thought: the following table demonstrates the potential power savings for an application increasing in efficiency from requiring 2 watts, to only 1.5 for a given quantity of users.
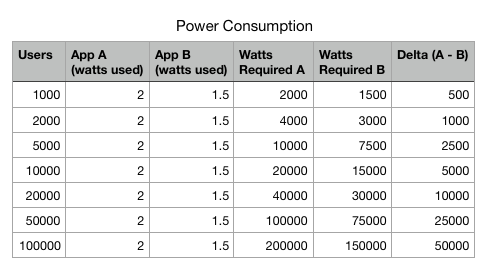
As you can see, the amount of power you save increases dramatically as your application scales.
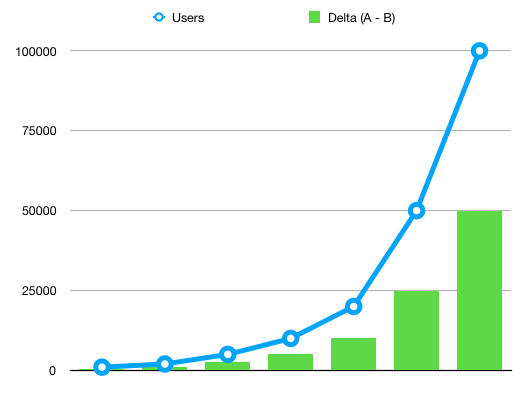
This means, that if you increase the efficiency of an application from 2 to 1.5 watts for 100,000 users, you've done the equivalent of installing 200 250 Watt Solar Panels. For a company like Slack, decisions like this could mean a difference equivalent to installing 12,000 250 Watt Solar Panels. That's quite a difference.