Bicycle Rain Avoidance System: R2Detour
The Idea
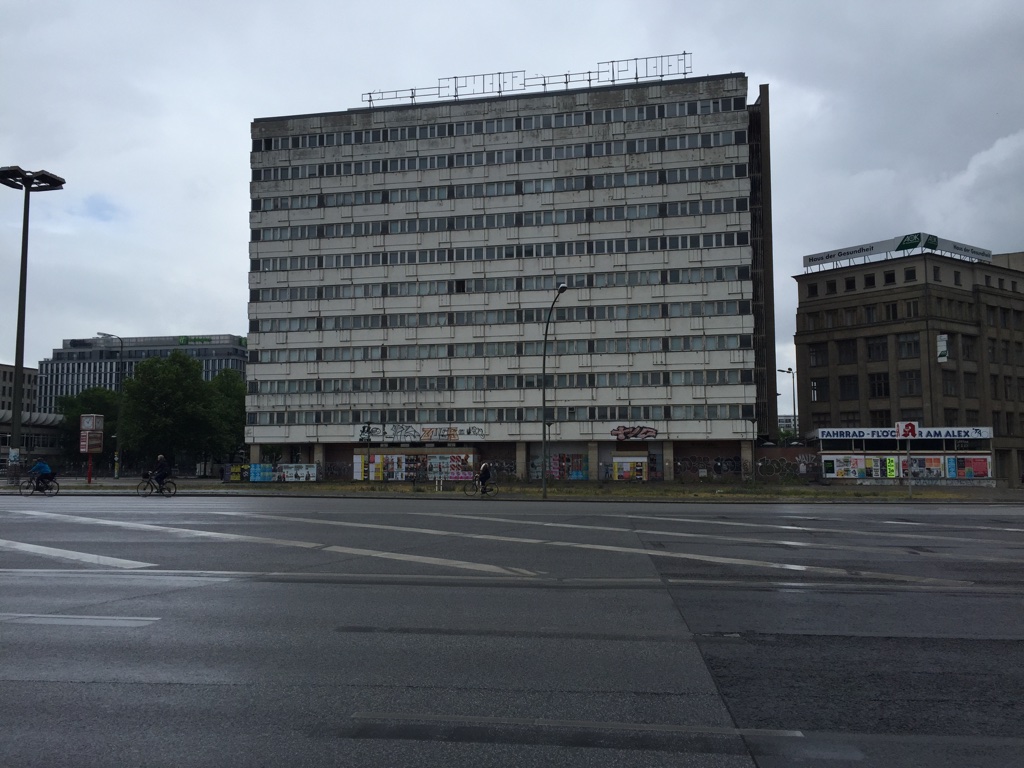
During a recent hackathon (Battlehack Berlin), I had a very serious problem. I had biked to the train station because I knew that the busses ran late and intermittently where I live. Unfortunately, it was also forecast to rain in Berlin, and I couldn't afford to get my laptop wet. This is nearby where we were to meetup- the weather doesn't look good:
From my basic meteorology knowledge, I knew that when prediction is made for a percent likelihood of rain for a particular city (e.g. 70% chance of rain over Chicago), what they mean is NOT that the meteorologist is 70% confident there will be rain, but rather that the rain is covering 70% of the surface of Chicago.
Knowing this information, I figured, if you could get up to date satellite images over a particular city, you might be able to calculate the least rainy route to a destination.
The Evolution
After some discussion with the group, we decided that it should be possible to input any sort of data and route towards or away from it. For example, go through Berlin while visiting as many coffee shops as possible while deviating no more than ten minutes off course.
The Rain Avoidance System
The first thing that was necessary for realizing the rain avoidance system was obtaining satellite images of clouds for any given region of the Earth. To do this, we used the Wunderground API system (http://www.wunderground.com/weather/api/d/docs?MR=1). An account is free up to a large number of requests, so it would be fine for the purposes of our hackathon.
Using the request url:
http://api.wunderground.com/api/f756c980df0d1838//radar/satellite/image.png?rad.maxlat=47.709&rad.maxlon=-69.263&rad.minlat=31.596&rad.minlon=-97.388&rad.width=640&rad.height=480&rad.rainsnow=1&rad.reproj.automerc=1&sat.maxlat=47.709&sat.maxlon=-69.263&sat.minlat=31.596&sat.minlon=-97.388&sat.width=640&sat.height=480&sat.key=sat_ir4_bottom&sat.gtt=107&sat.proj=me&sat.timelabel=0
We were able to get the following image:
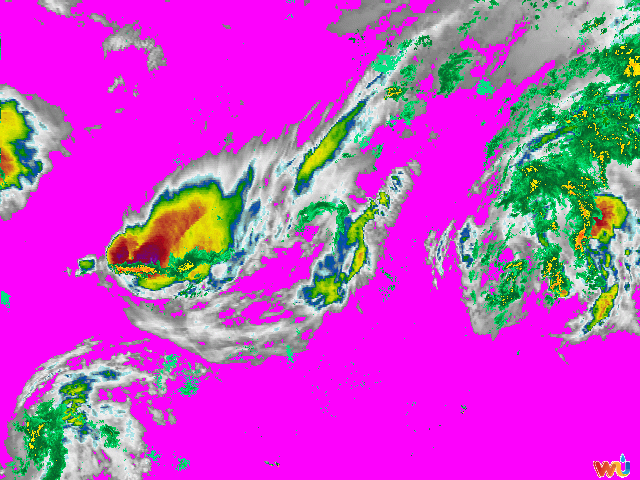
This image was for the coordinates of:
rad.maxlat=47.709&rad.maxlon=-69.263&rad.minlat=31.596&rad.minlon=-97.388&
Using the API it was also possible to specify the bounds, resolution, etc. For the purposes of our demo, we picked a random set of coordinates used as an example in the API and got an image. In the above image you can very clearly see where the rain is located in the dark red spots. The yellow represents less intense, followed by green, blue, and then gray. Pink (or alpha) represents no clouds at all. The code that I used to do this was the following:
import requests
r = requests.get("http://api.wunderground.com/api/f756c980df0d1838//radar/satellite/image.png?rad.maxlat=47.709&rad.maxlon=-69.263&rad.minlat=31.596&rad.minlon=-97.388&rad.width=640&rad.height=480&rad.rainsnow=1&rad.reproj.automerc=1&sat.maxlat=47.709&sat.maxlon=-69.263&sat.minlat=31.596&sat.minlon=-97.388&sat.width=640&sat.height=480&sat.key=sat_ir4_bottom&sat.gtt=107&sat.proj=me&sat.timelabel=0")

print r.status_code
#print r.headers
#print r.content

f = open('file.png', 'wb')
f.write(r.content)
f.close()
Image Processing & Manipulation
The next step which was necessary was to do blob detection on the data. To do this we needed to construct bounding polygons around the rain areas in geo-json (http://geojson.org). This would make it easier to do processing of routes and would save on the large amounts of data. This involved installing openCV on my machine and getting it to work with python. Unfortunately I was not able to get the installation to work properly. After many hours I tried a different strategy. Using the pillow library I shrunk the image down to a significantly smaller size to reduce the amount of data points and potential colors. This produced an image like this:

If we increase the size of the image we can see this:
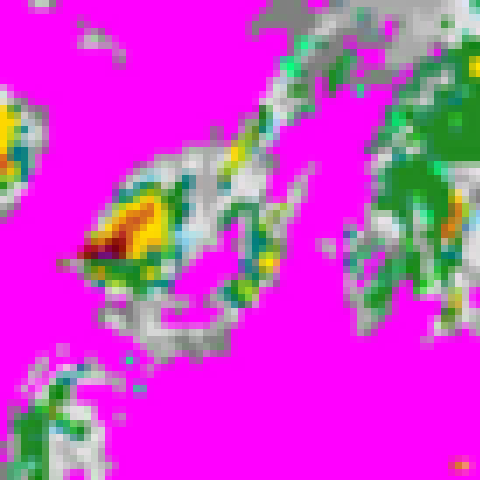
As you can see there are significantly less colors (limited to a palette) and fewer data points to deal with. This should make processing much easier.
To do this, I used the following code:
from PIL import Image
import operator
from collections import defaultdict
import re

input_path = 'file.png'
output_path = 'output.png'
size = (50,50)

palette = [
(128,0,0),
(165,42,42),
(178,34,34),
(220,20,60),
# ...
(211,211,211),
(220,220,220),
(245,245,245),
(255,255,255),
]

while len(palette) < 256:
    palette.append((0, 0, 0))

flat_palette = reduce(lambda a, b: a+b, palette)
assert len(flat_palette) == 768

palette_img = Image.new('P', (1, 1), 0)
palette_img.putpalette(flat_palette)

multiplier = 8
img = Image.open(input_path)
img = img.convert('RGB')
img = img.resize((size[0] * multiplier, size[1] * multiplier), Image.BICUBIC)
img = img.quantize(palette=palette_img) #reduce the palette

img = img.convert('RGB')

out = Image.new('RGB', size)
for x in range(size[0]):
    for y in range(size[1]):
        #sample at get average color in the corresponding square
        histogram = defaultdict(int)
        for x2 in range(x * multiplier, (x + 1) * multiplier):
        for y2 in range(y * multiplier, (y + 1) * multiplier):
        histogram[img.getpixel((x2,y2))] += 1
        color = max(histogram.iteritems(), key=operator.itemgetter(1))[0]
        out.putpixel((x, y), color)

out.save(output_path)
Coordinate Extraction & Data Generation
After having done that it was necessary to do some processing to get the most important coordinates for representation and calculation on the map. Using the now refined image, I ran the following code:
from __future__ import division
from PIL import Image

im = Image.open("output.png")
(width, height) = im.size

originX = 13.39
terminusX = 13.41
rangeX = terminusX - originX

originY = 52.51
terminusY = 52.53
rangeY = terminusY - originY

# Matrix
matrix = [[0 for x in range(width)] for y in range(height)]

# Matrix Index
i = 0
j = 0
for pixel in iter(im.getdata()):
 matrix[i][j] = pixel
 i = i + 1
 if i >= width:
 i = 0
 j = j+1

for z in range (0, width):
     for n in range (0, height):
         li = matrix[z][n]
         sum = 0
         for q in li:
         sum = sum + q
         # Generate Coordinate String
         offsetX = rangeX * (z/width)
         offsetY = rangeY * (n/height)
         if ((int)((sum / 765) * 100) > 66):
         print "{location: new google.maps.LatLng(%f, %f), weight: %d}," % (offsetY + originY, offsetX + originX, ((sum / 765) * 100),)
Success!
This code would get all of the images that had a color intensity (r,g,b) greater than 66. This would ensure that I would be getting only the points on a map where it was definitely raining. This had the effect of producing the following when plotted on our maps:
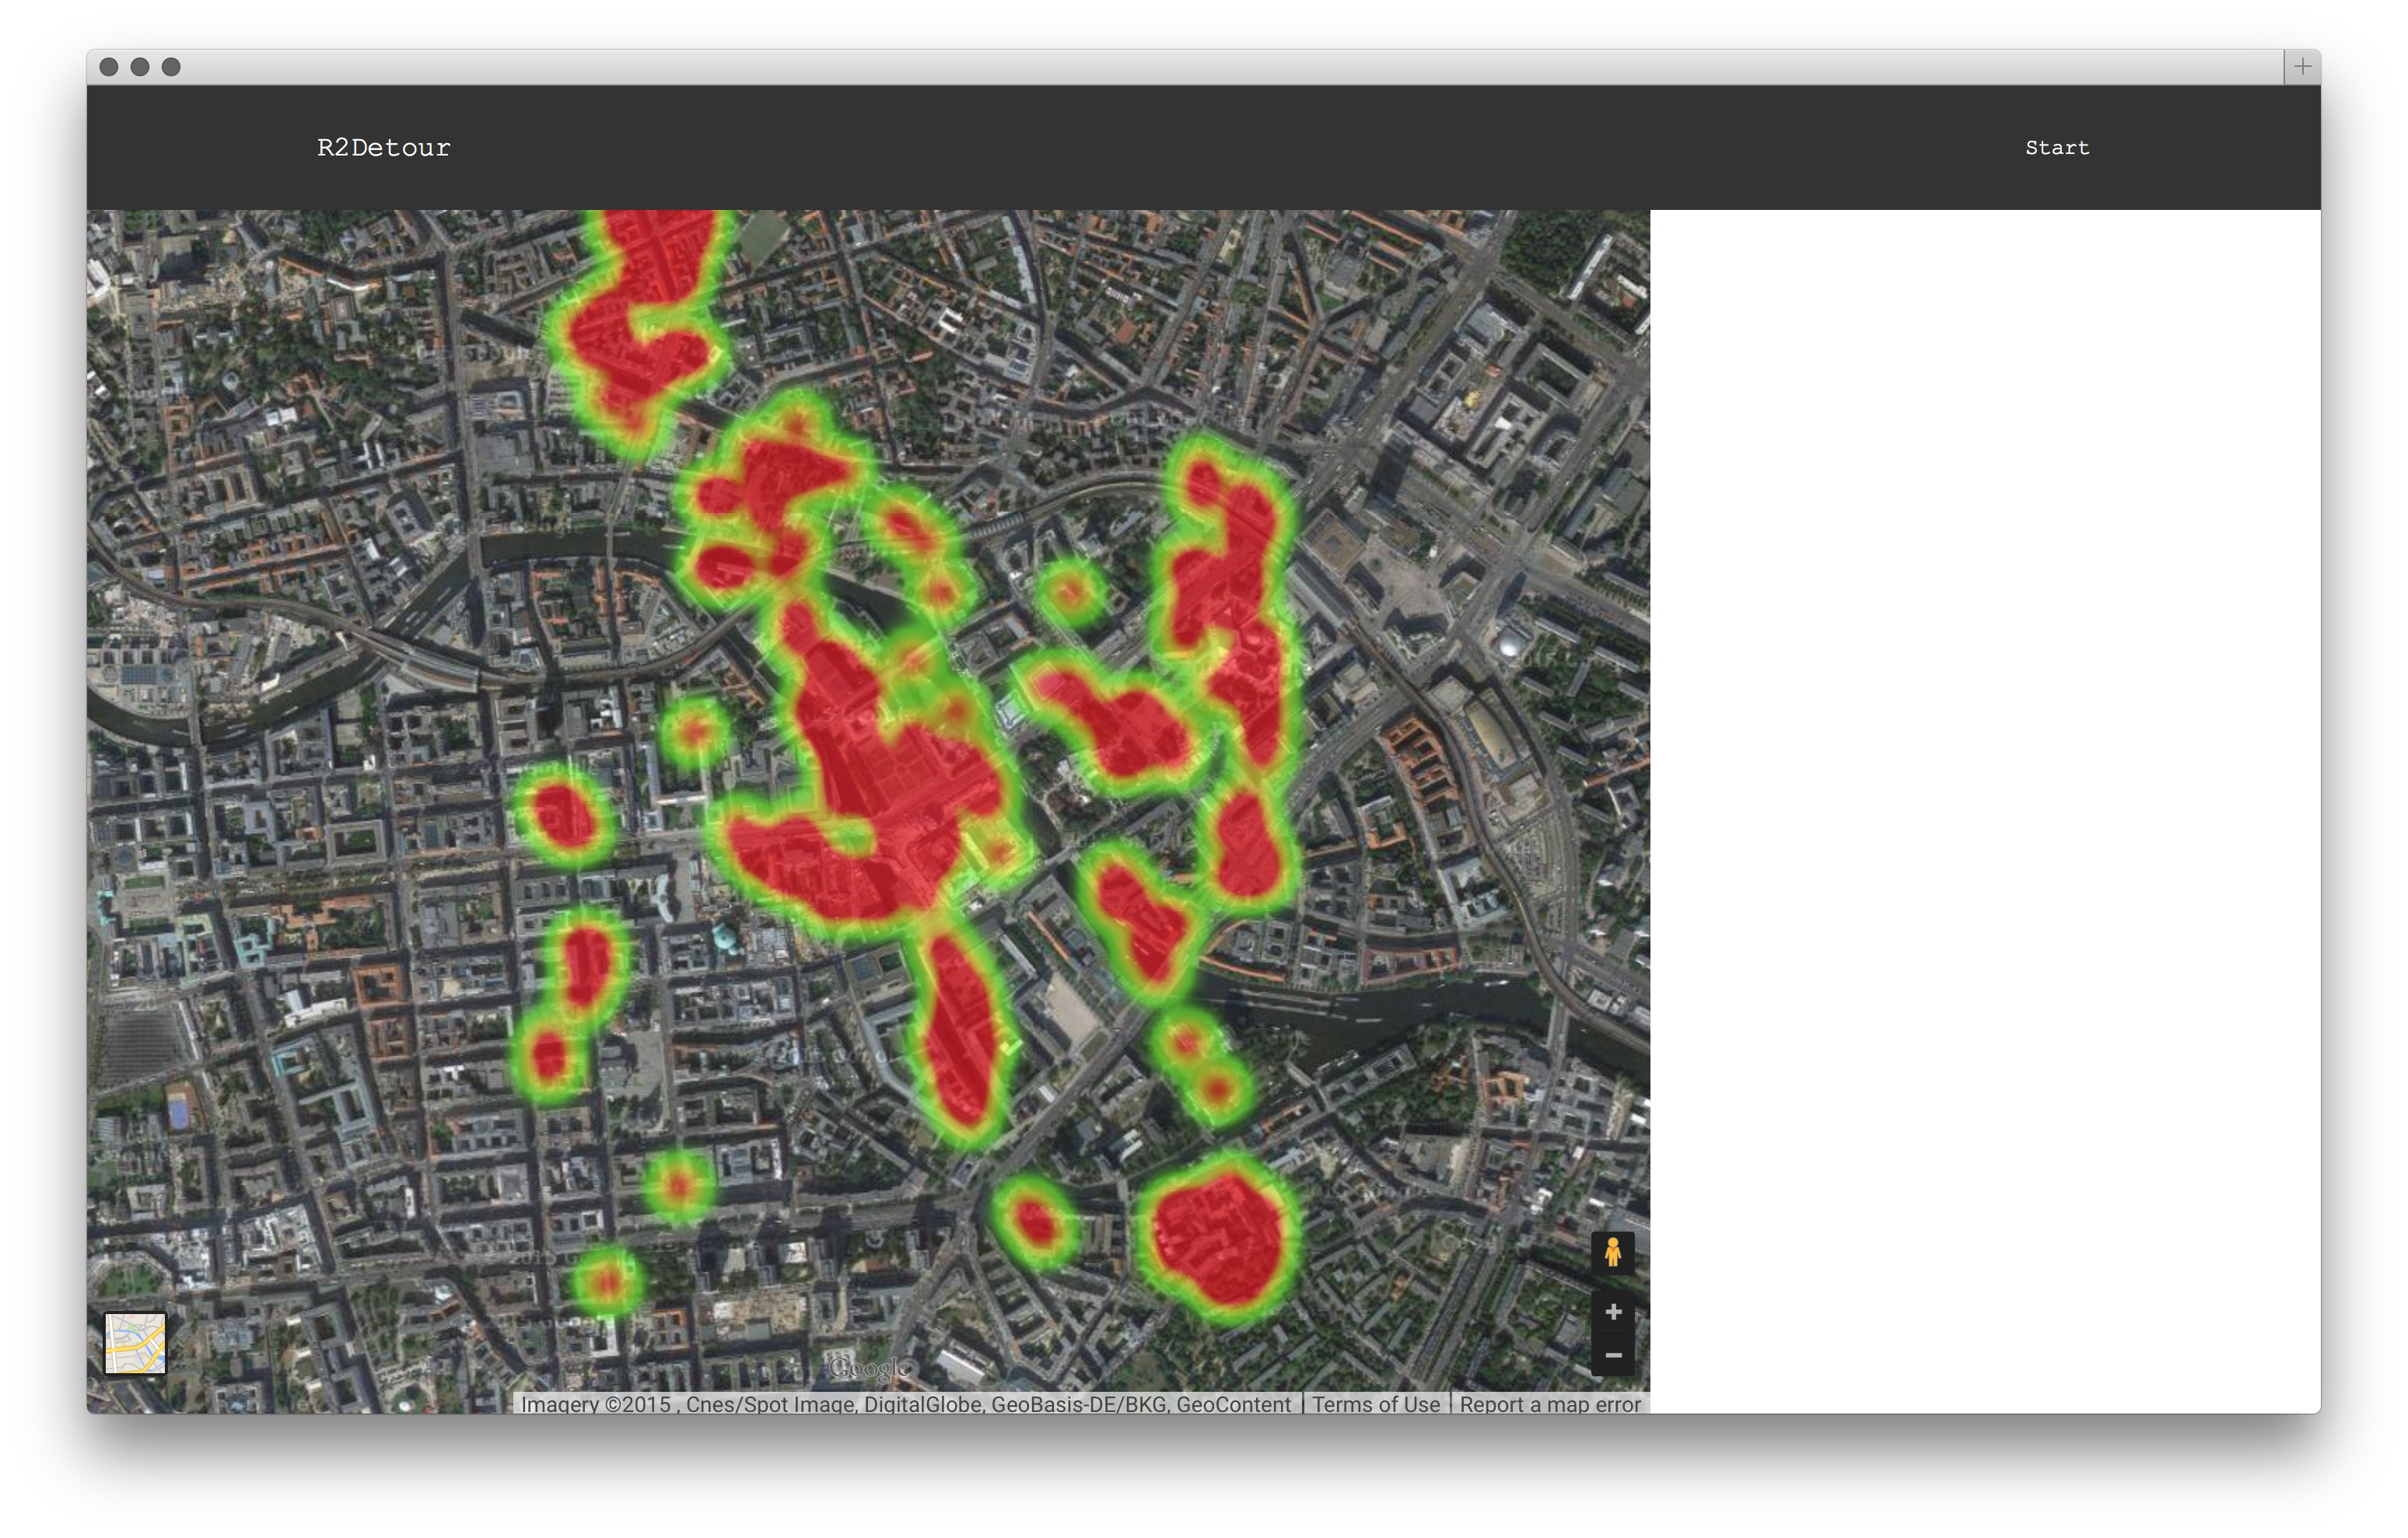
It works!!! Unfortunately our weather data is mirrored across the Y axis, but that is proof enough for us. We tried several other cool data sets. Another interesting one that we tried was the statistical data available about bicycle accidents at different intersections in London. Using this data we could plot a safer route.
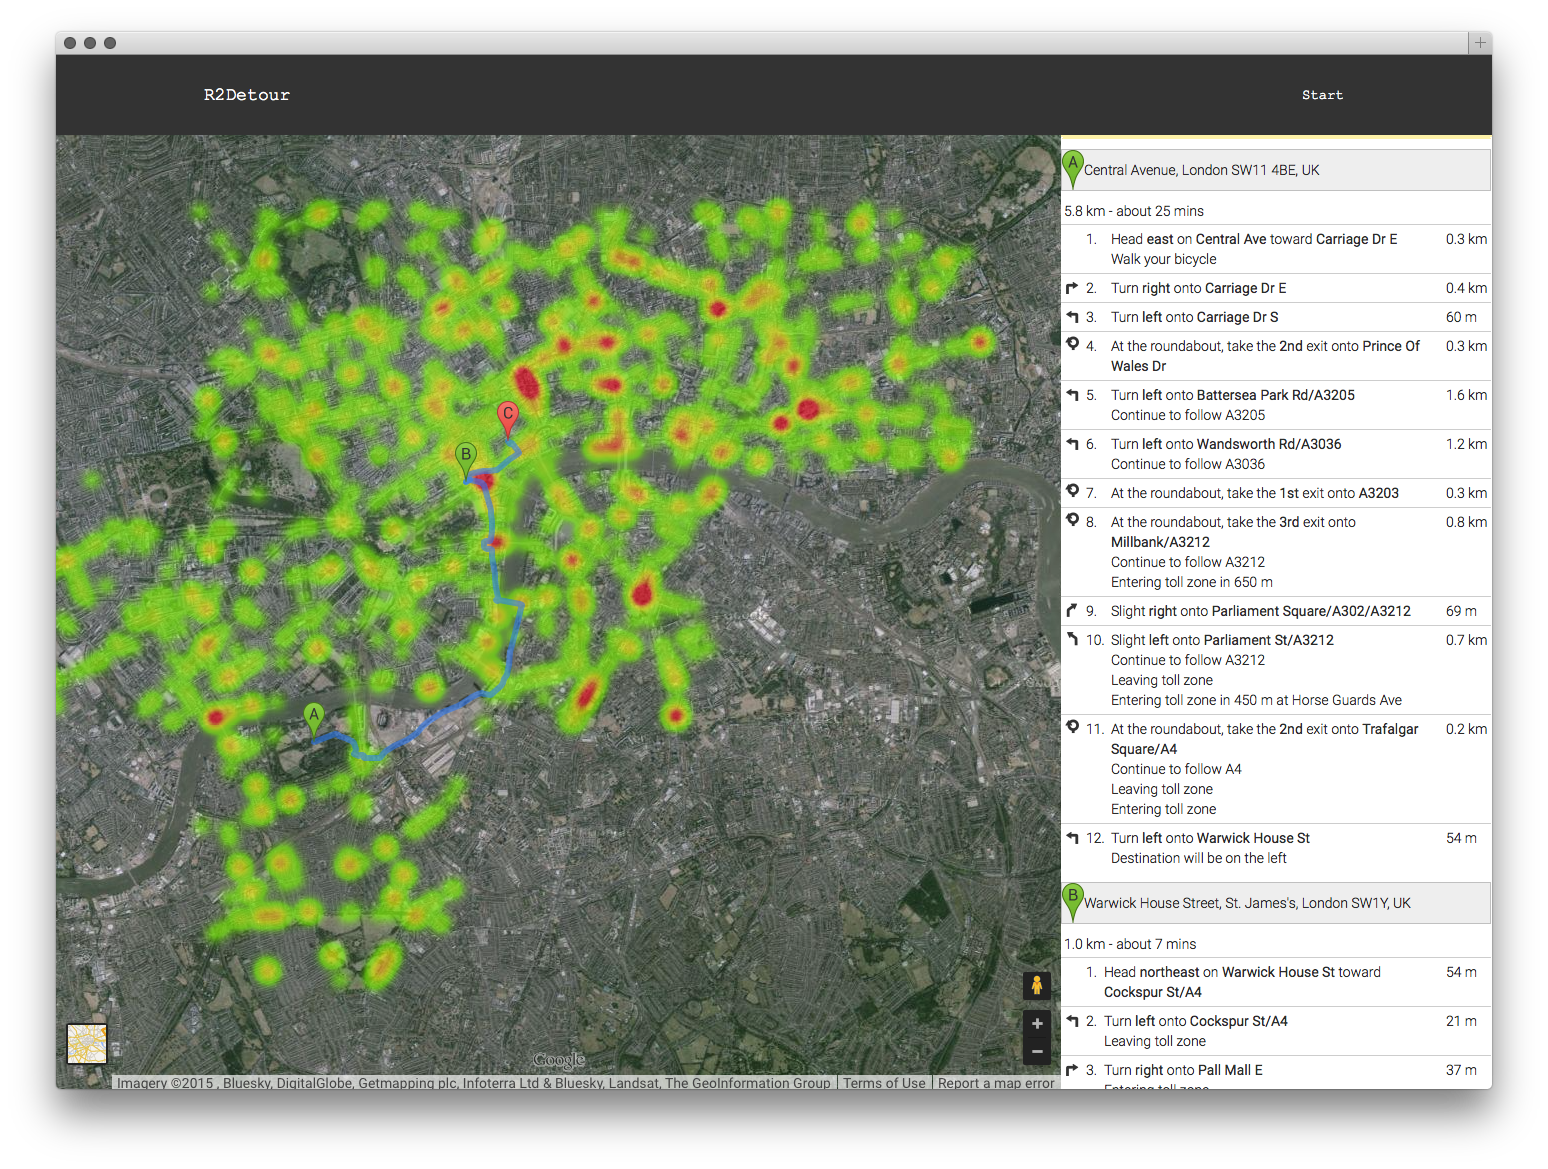
As you can see, the program actively avoids hotspots of high incidence while deviating you insignificantly from your course. If you look even closer, the routing scheme becomes more obvious:
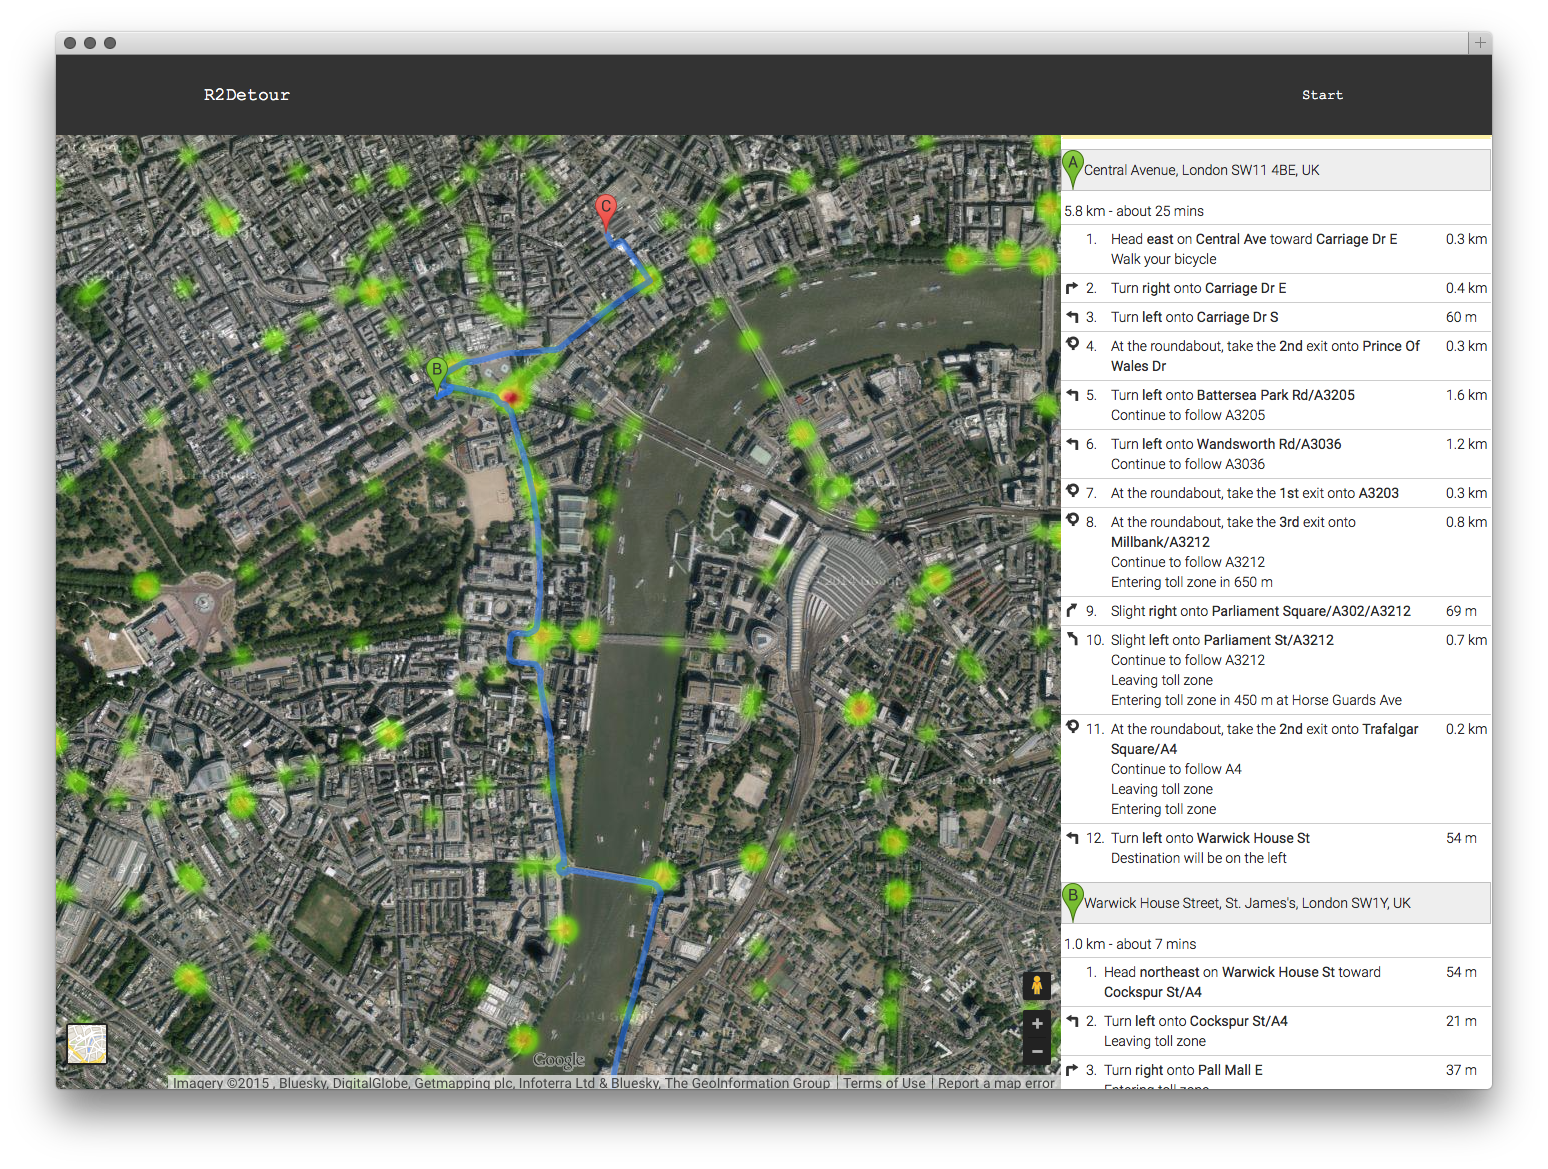
We used google maps for all of our routing, but placed pins to change the route whenever a trouble area arises. In this way we didn't have to do calculation for one way roads, traffic etc. This could all still be natively handled by google.
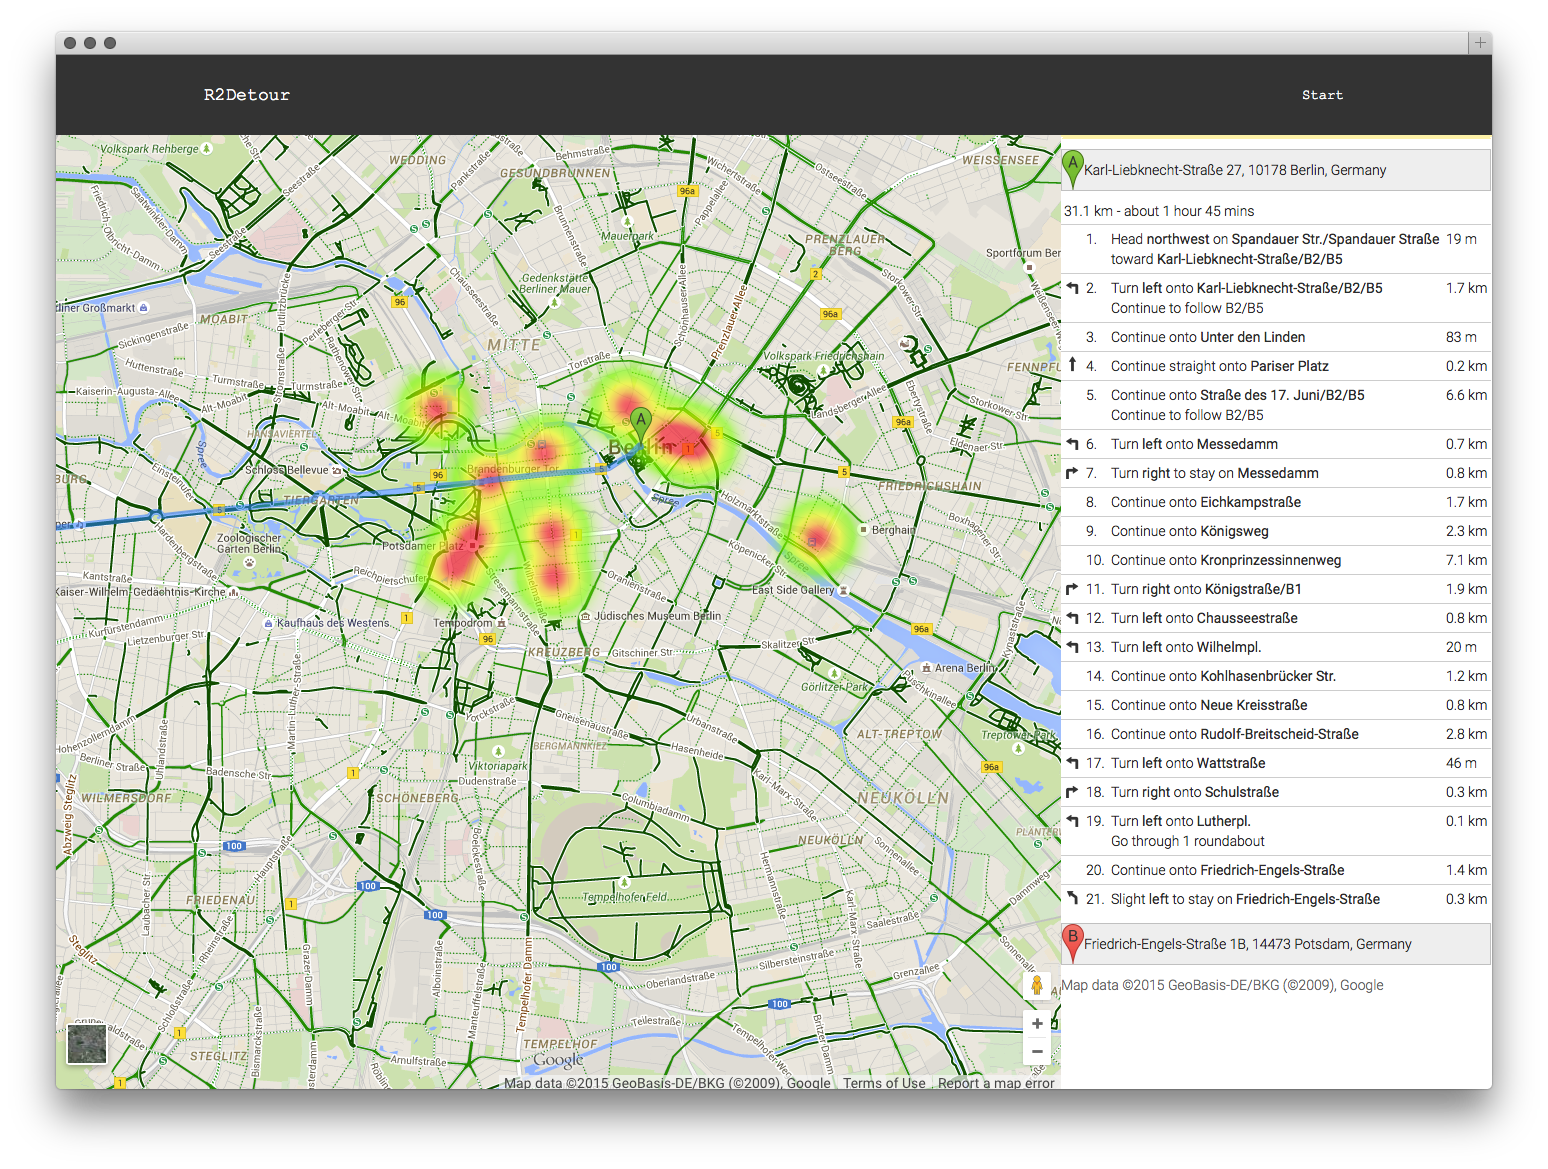
The final one that we demoed was a list of coffee shops in Berlin, it produces a pretty interesting map:
Conclusions
R2Detour turned out to be a very interesting program. I worked with two very talented programmers who handled all of the routing, and the actual web application whereas I did the image and satellite processing. We developed a really rough prototype that works on basic principles, but it works. In the future we could properly do blob detection, geojson, and smarter routing that can handle more points. Thanks for reading!
The Repositories
The code for the weather analysis is available here:
https://bitbucket.org/jmercouris/satellite-doppler-analysis-engine/src
The code for the website/routing is available here:
Extras
Some snacks they served at the hackathon (peanut butter cookies with chocolate ice cream):
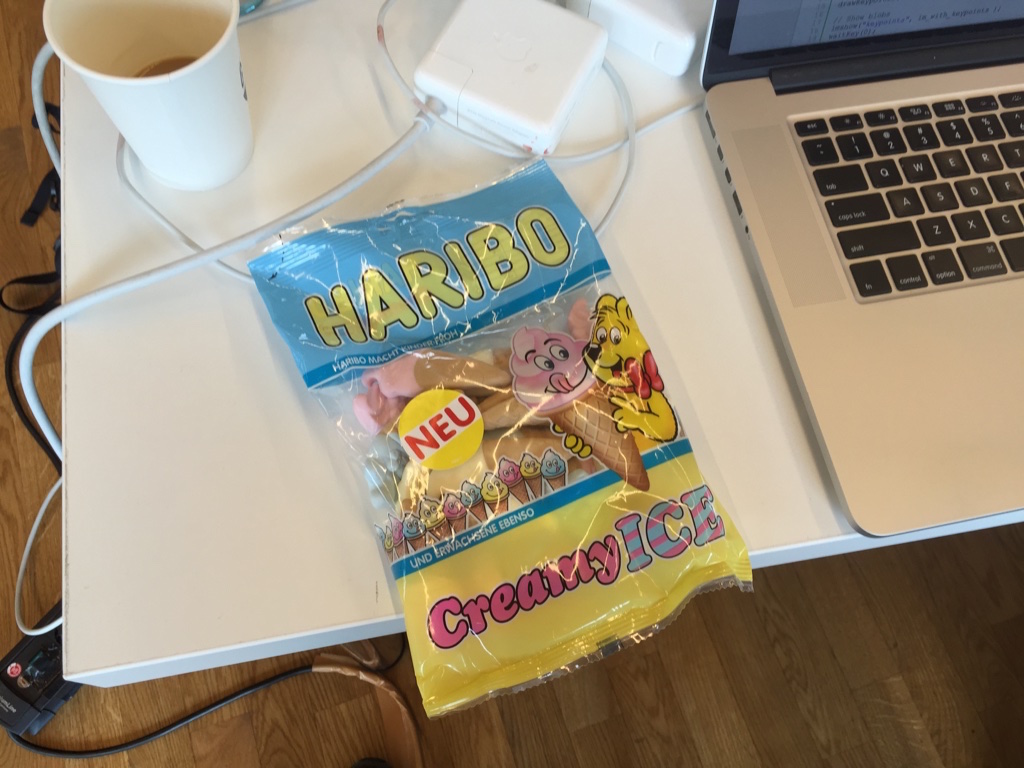
Some interesting Haribo gummy ice creams I had never seen before. They tasted vaguely of cotton candy.